HTTP Logger Plugin
API observability is the ability to understand system behavior and investigate the interactions between an application’s components. It provides for your API tracers, metrics and loggers.
The core of API observability breaks down into three key areas: structured logs, metrics, and traces. Let’s break down each pillar and learn how with Apache APISIX Plugins we can simplify these tasks.
Logs are also easy to instrument and trivial step of API observability. An API event is logged each time an API operation is invoked. You can gain analytic insights into your API activities or debug your APIs through the logged data
For instance, HTTP logger Plugin pushes Log data requests to HTTP/HTTPS servers or sends as JSON objects to Monitoring tools.
The following is an example of how to enable the http-logger for our specific route. You could generate a mock HTTP server at mockbin to view the logs.
To http-logger settings, we can just put our mock server uri address like below:
{"uri": "http://mockbin.org/bin/5451b7cd-af27-41b8-8df1-282ffea13a61"}curl http://127.0.0.1:9080/apisix/admin/routes/1 -H 'X-API-KEY: edd1c9f034335f136f87ad84b625c8f1' -X PUT -d '
{
"plugins": {
"http-logger": {
"uri": "http://mockbin.org/bin/5451b7cd-af27-41b8-8df1-282ffea13a61"
}
},
"upstream_id": "1",
"uri": "/get"
}'You will get the following response:
{
"node": {
"value": {
"update_time": 1648189729,
"uri": "/get",
"create_time": 1646341656,
"status": 1,
"priority": 0,
"upstream_id": "1",
"plugins": {
"http-logger": {
"include_resp_body": false,
"timeout": 3,
"include_req_body": false,
"concat_method": "json",
"name": "http logger",
"auth_header": "",
"uri": "http://mockbin.org/bin/5451b7cd-af27-41b8-8df1-282ffea13a61",
"batch_max_size": 1000,
"max_retry_count": 0,
"retry_delay": 1,
"buffer_duration": 60,
"inactive_timeout": 5
}
},
"id": "1"
},
"key": "/apisix/routes/1"
},
"action": "set"
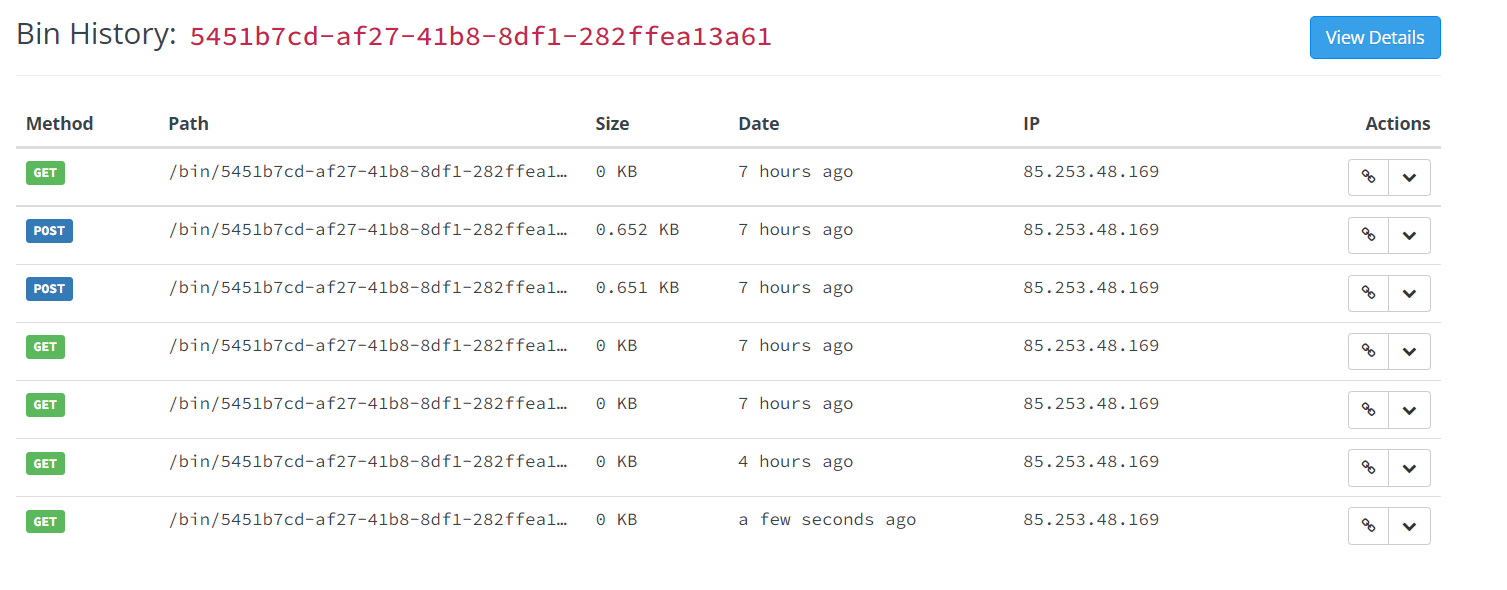
}We can send a request to this get endpoint to generate logs.
curl -i http://127.0.0.1:9080/getAs you can see, some recent logs are sent to our mock server:
Prometheus plugin
API monitoring is the process of collecting and analyzing data about the performance of an API to identify problems that impact users. If an application is running slowly, you must first understand the cause before you can correct it.
Modern applications use many independent microservices instead of a few large ones, and one poor-performing service can adversely impact the overall performance of an application. In addition, isolating a single poor-performing service among hundreds can be a challenge unless proper monitoring is in place. This makes API monitoring and measuring API performance a crucial practice for modern multi-cloud environments.
Prometheus plugin can fetch API metrics data and you can show metrics exported by the plugin in Grafana.
Let’s enable prometheus plugin for our route:
curl http://127.0.0.1:9080/apisix/admin/routes/1  -H 'X-API-KEY: edd1c9f034335f136f87ad84b625c8f1' -X PUT -d '
{
    "uri": "/get",
    "plugins": {
        "prometheus":{}
    },
    "upstream_id": "1"
}'|
When set prefer_name to true in the request attribute, it will print route/service name instead of id in Prometheus metric. |
Response:
{
  "node": {
    "value": {
      "update_time": 1648206467,
      "uri": "/get",
      "create_time": 1646341656,
      "status": 1,
      "priority": 0,
      "plugins": {
        "prometheus": {
          "prefer_name": false
        }
      },
      "upstream_id": "1",
      "id": "1"
    },
    "key": "/apisix/routes/1"
  },
  "action": "set"
}
We fetch the metric data from the specified url /apisix/prometheus/metrics.
curl -i http://127.0.0.1:9091/apisix/prometheus/metricsYou will get response with Prometheus metrics something like below:
HTTP/1.1 200 OK
Server: openresty
Date: Fri, 25 Mar 2022 11:13:14 GMT
Content-Type: text/plain; charset=utf-8
Transfer-Encoding: chunked
Connection: keep-alive

# HELP apisix_batch_process_entries batch process remaining entries
# TYPE apisix_batch_process_entries gauge
apisix_batch_process_entries{name="http logger",route_id="1",server_addr="172.19.0.8"} 0
# HELP apisix_etcd_modify_indexes Etcd modify index for APISIX keys
# TYPE apisix_etcd_modify_indexes gauge
apisix_etcd_modify_indexes{key="consumers"} 17819
apisix_etcd_modify_indexes{key="global_rules"} 17832
apisix_etcd_modify_indexes{key="max_modify_index"} 20028
apisix_etcd_modify_indexes{key="prev_index"} 18963
apisix_etcd_modify_indexes{key="protos"} 0
apisix_etcd_modify_indexes{key="routes"} 20028
apisix_etcd_modify_indexes{key="services"} 0
apisix_etcd_modify_indexes{key="ssls"} 0
apisix_etcd_modify_indexes{key="stream_routes"} 0
apisix_etcd_modify_indexes{key="upstreams"} 7342
apisix_etcd_modify_indexes{key="x_etcd_index"} 20033

...
And we can also check the status of our endpoint at Prometheus dashboard by pointing to this
URL http://localhost:9090/targets
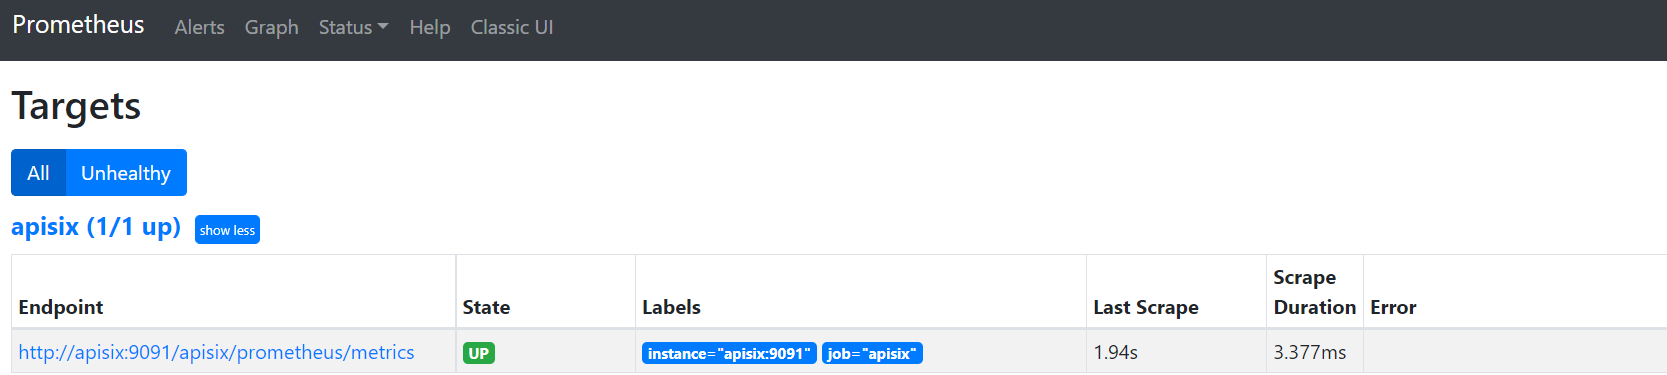
As you can see, Apache APISIX exposed metrics endpoint is upon and running.
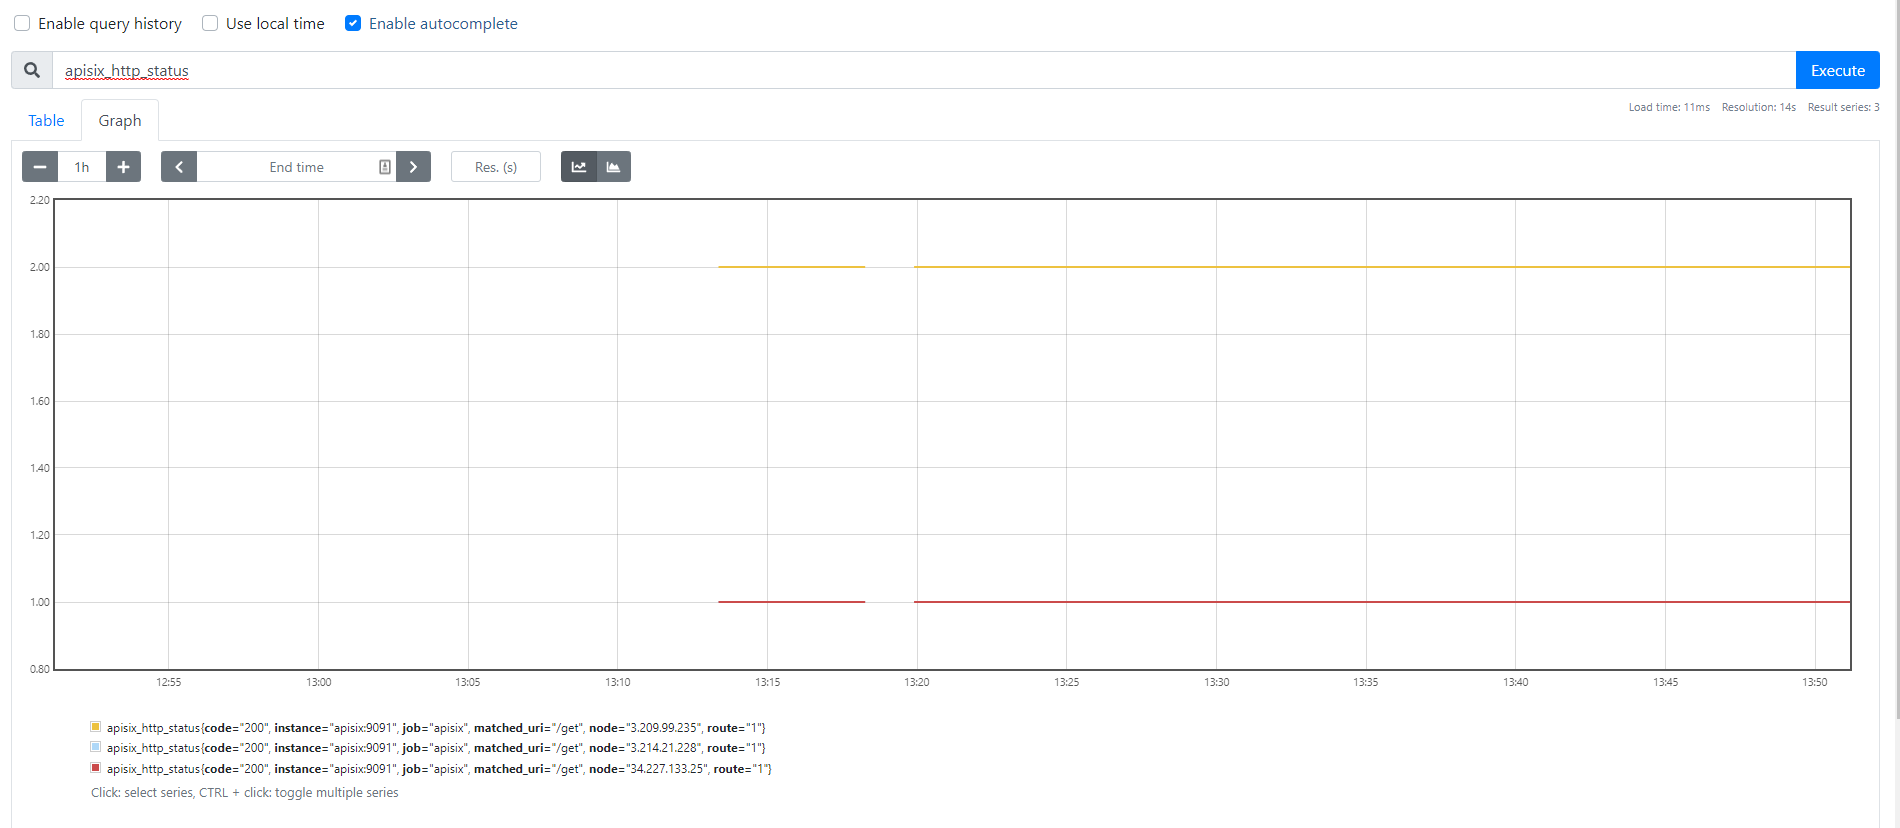
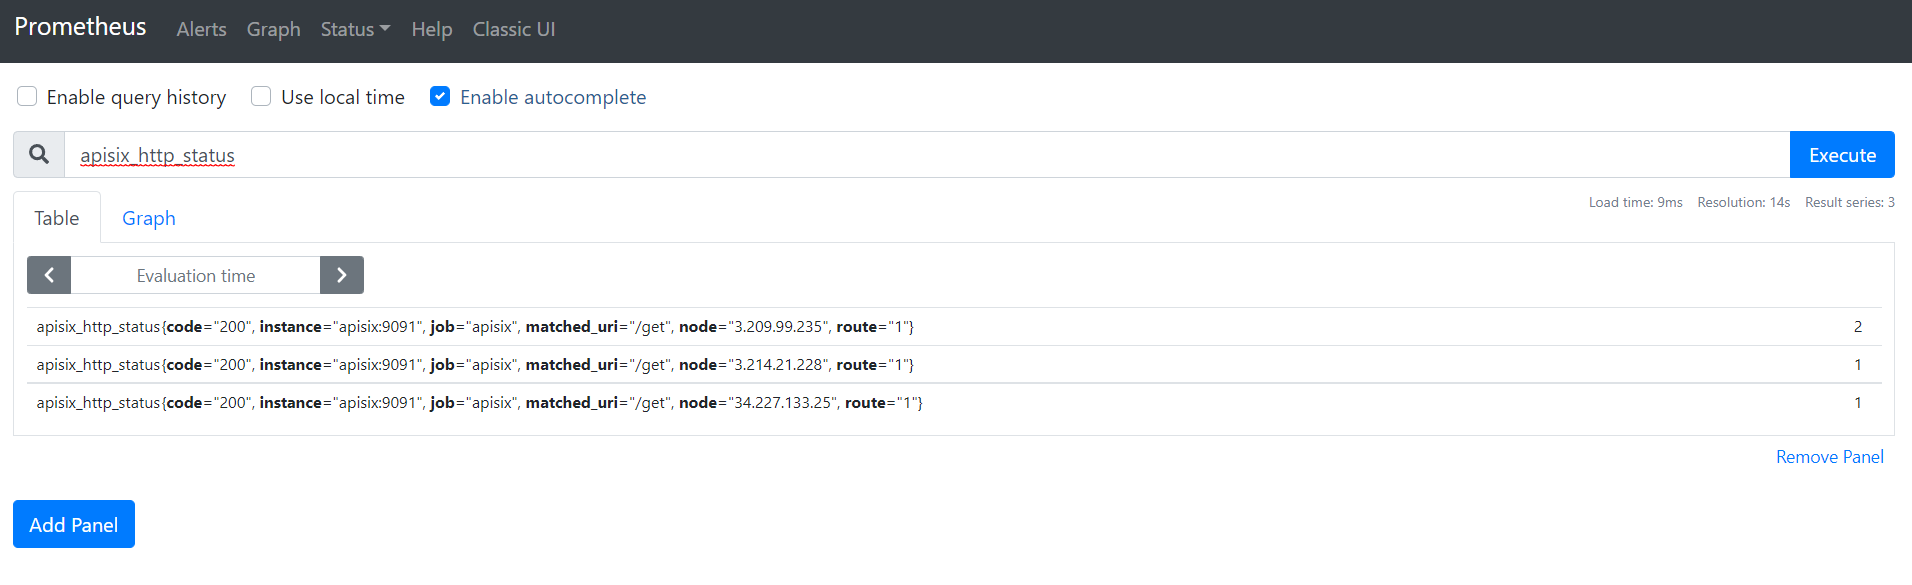
Now you can query metrics for apisix_http_status to see what http requests are handled by API Gateway and what was outcome.
|
Metrics exported by the plugin can be visualized in Grafana using a drop in Apache APISIX Grafana Dashboard Template |
In addition to this, you can view Grafana dashboard running in your local instance. Go to http://localhost:3000/
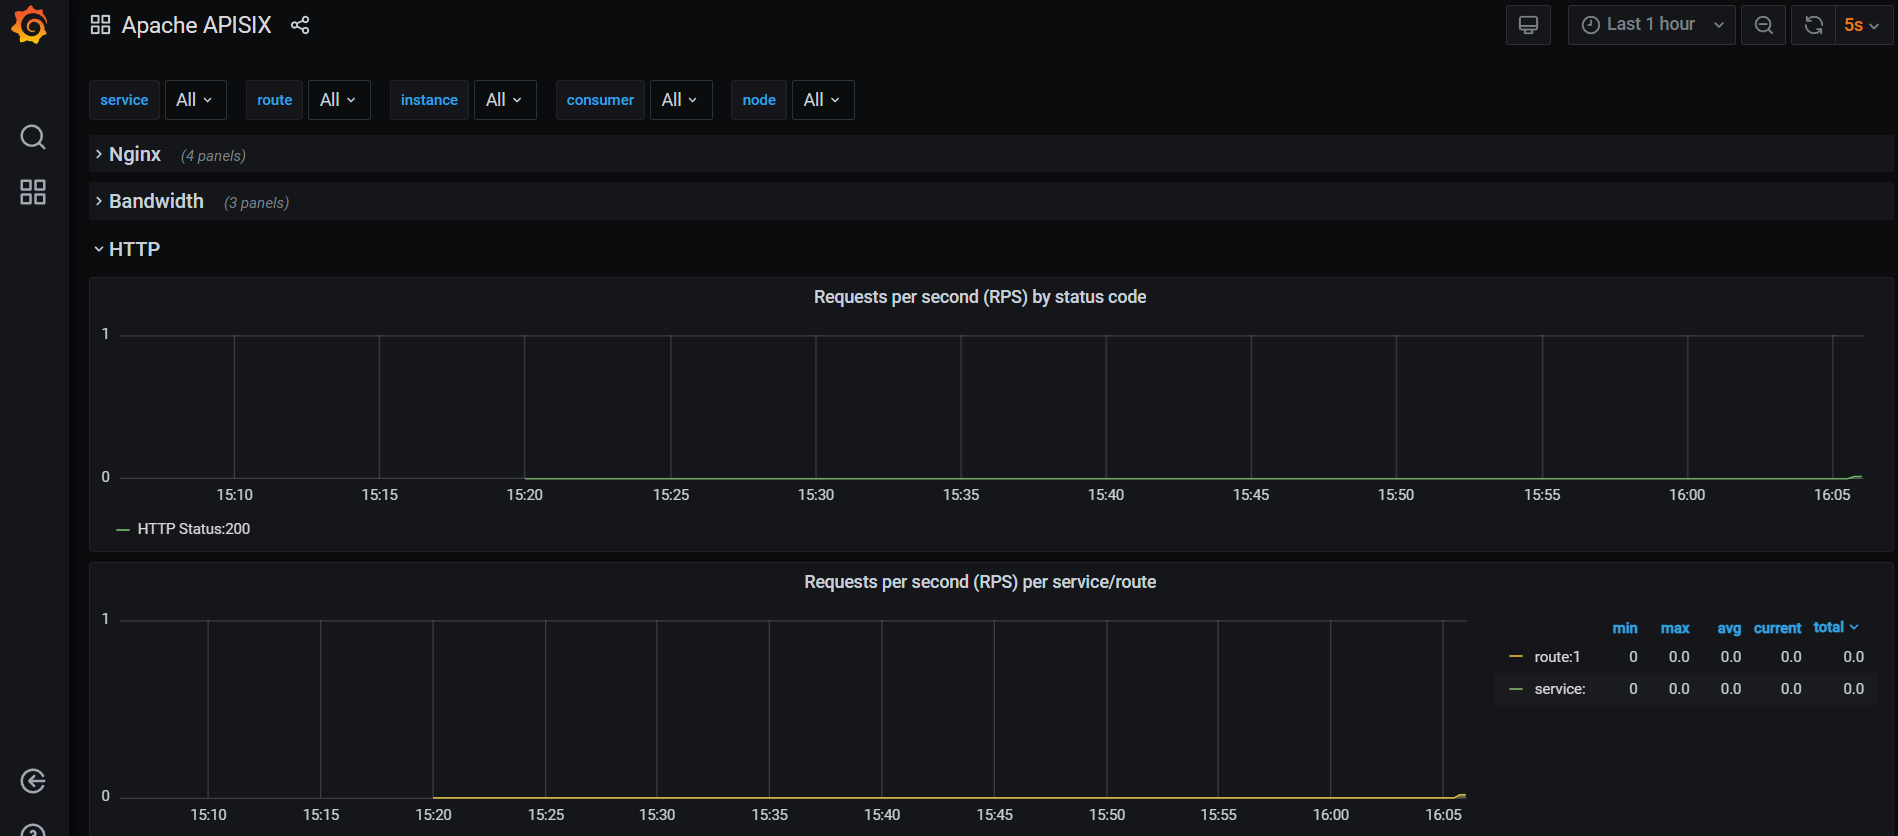
Behind the scene, Apache APISIX downloads Grafana dashboard meta, imports it to Grafana and fetches real time metrics from Prometheus plugin.
Zipkin Plugin
The third observability pillar is a tracing or distributed tracing allows you to understand the life of a request as it traverses your service network allows you to answer questions like what service has this request touched and how much latency was introduced.
Traces enable you to further explore which logs to look at for a particular session or related set of API calls.
Zipkin an open source distributed tracing system. APISIX Zipkin plugin is supported to collect tracing and report to Zipkin Collector based on Zipkin API specification.
Here’s an example to enable the zipkin plugin on the specified route:
curl http://127.0.0.1:9080/apisix/admin/routes/1  -H 'X-API-KEY: edd1c9f034335f136f87ad84b625c8f1' -X PUT -d '
{
    "methods": ["GET"],
    "uri": "/get",
    "plugins": {
        "zipkin": {
            "endpoint": "http://127.0.0.1:9411/api/v2/spans",
            "sample_ratio": 1
        }
    },
    "upstream_id": "1"
}'
Successful response looks like below:
{
  "node": {
    "key": "/apisix/routes/1",
    "value": {
      "upstream_id": "1",
      "status": 1,
      "create_time": 1646341656,
      "uri": "/get",
      "methods": [
        "GET"
      ],
      "update_time": 1648558131,
      "id": "1",
      "plugins": {
        "zipkin": {
          "endpoint": "http://127.0.0.1:9411/api/v2/spans",
          "span_version": 2,
          "server_addr": "<your-local-ip-address>",
          "service_name": "APISIX",
          "sample_ratio": 1
        }
      },
      "priority": 0
    }
  },
  "action": "set"
}
We can test our example by simple running the following command:
curl -i http://127.0.0.1:9080/getResponse:
HTTP/1.1 200 OK
Content-Type: application/json
Content-Length: 469
Connection: keep-alive
Date: Thu, 31 Mar 2022 10:03:26 GMT
Access-Control-Allow-Origin: *
Access-Control-Allow-Credentials: true
Server: APISIX/2.13.0
{
"args": {},
"headers": {
"Accept": "*/*",
"Host": "127.0.0.1",
"User-Agent": "curl/7.68.0",
"X-Amzn-Trace-Id": "Root=1-62457c6e-0dc0ed5b49ccc6fc7956dc2e",
"X-B3-Parentspanid": "61bd3f4046a800e7",
"X-B3-Sampled": "1",
"X-B3-Spanid": "855cd5465957f414",
"X-B3-Traceid": "e18985df47dab632d62083fd96626692",
"X-Forwarded-Host": "127.0.0.1"
},
"origin": "172.19.0.1, 85.253.48.169",
"url": "http://127.0.0.1/get"
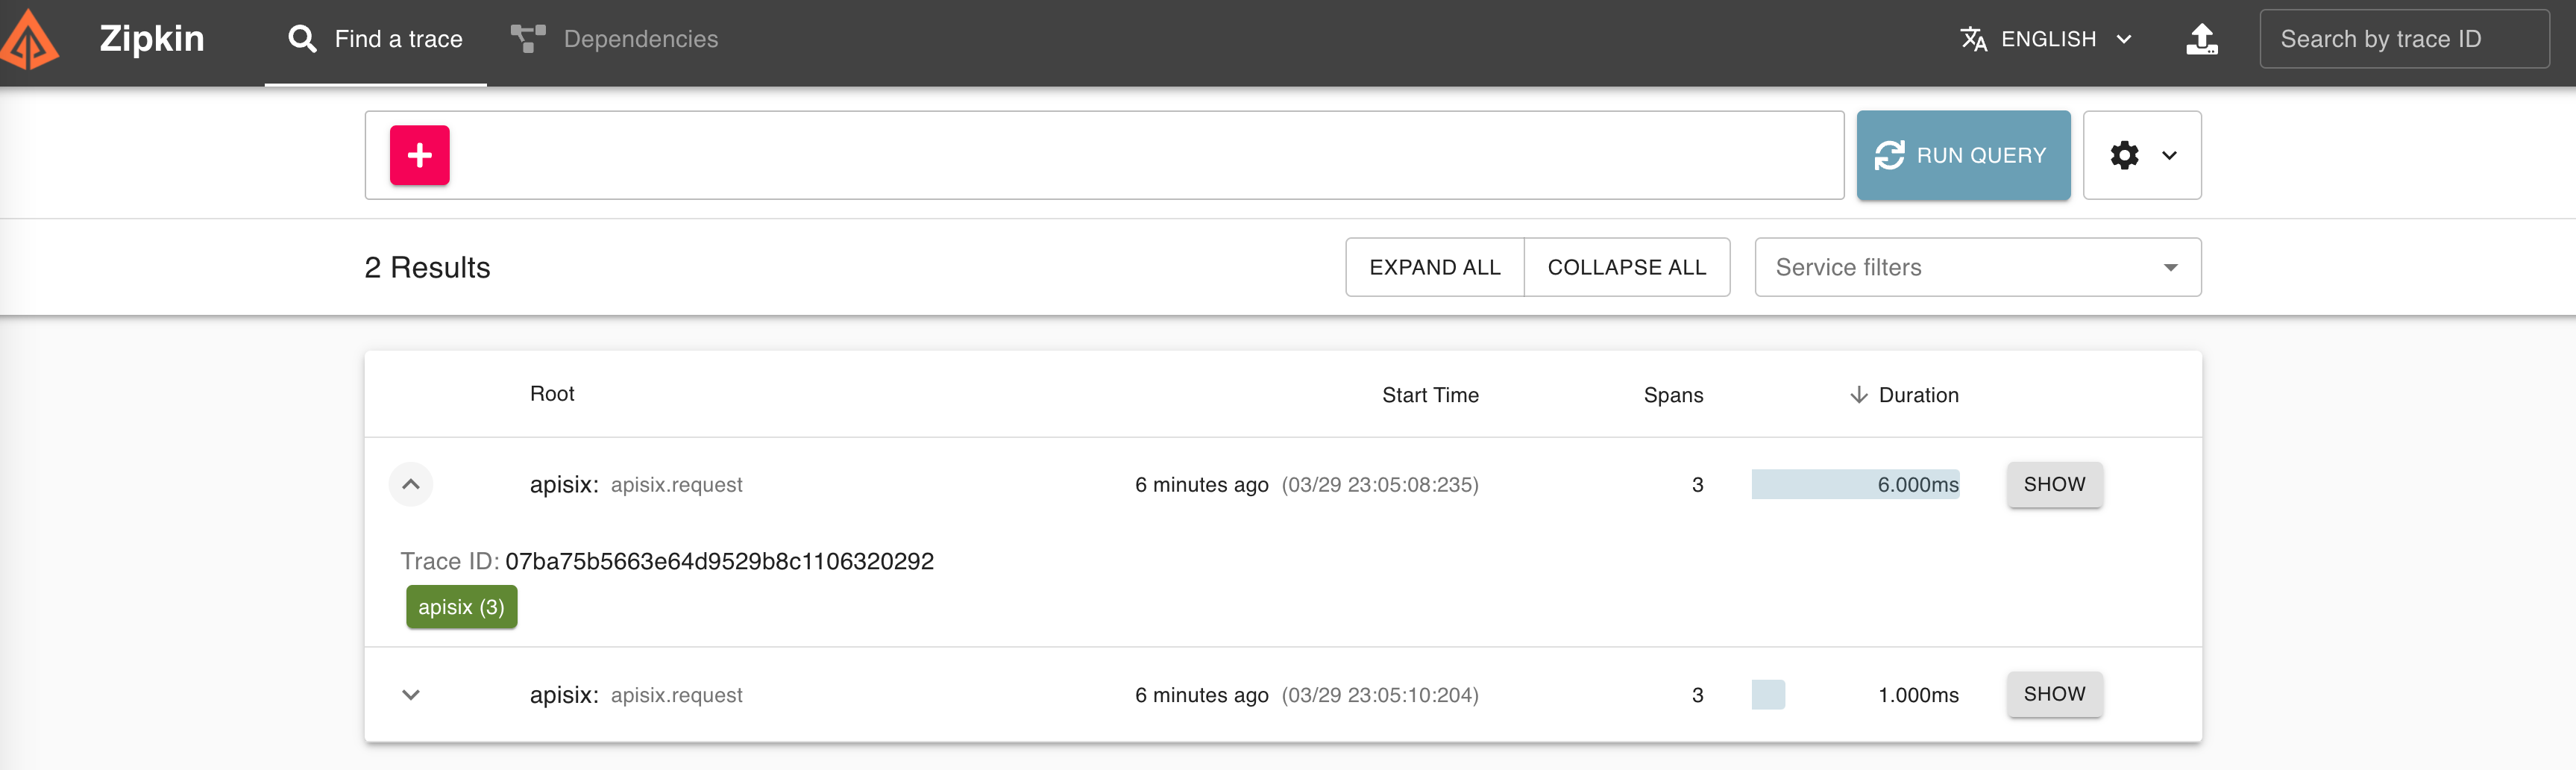
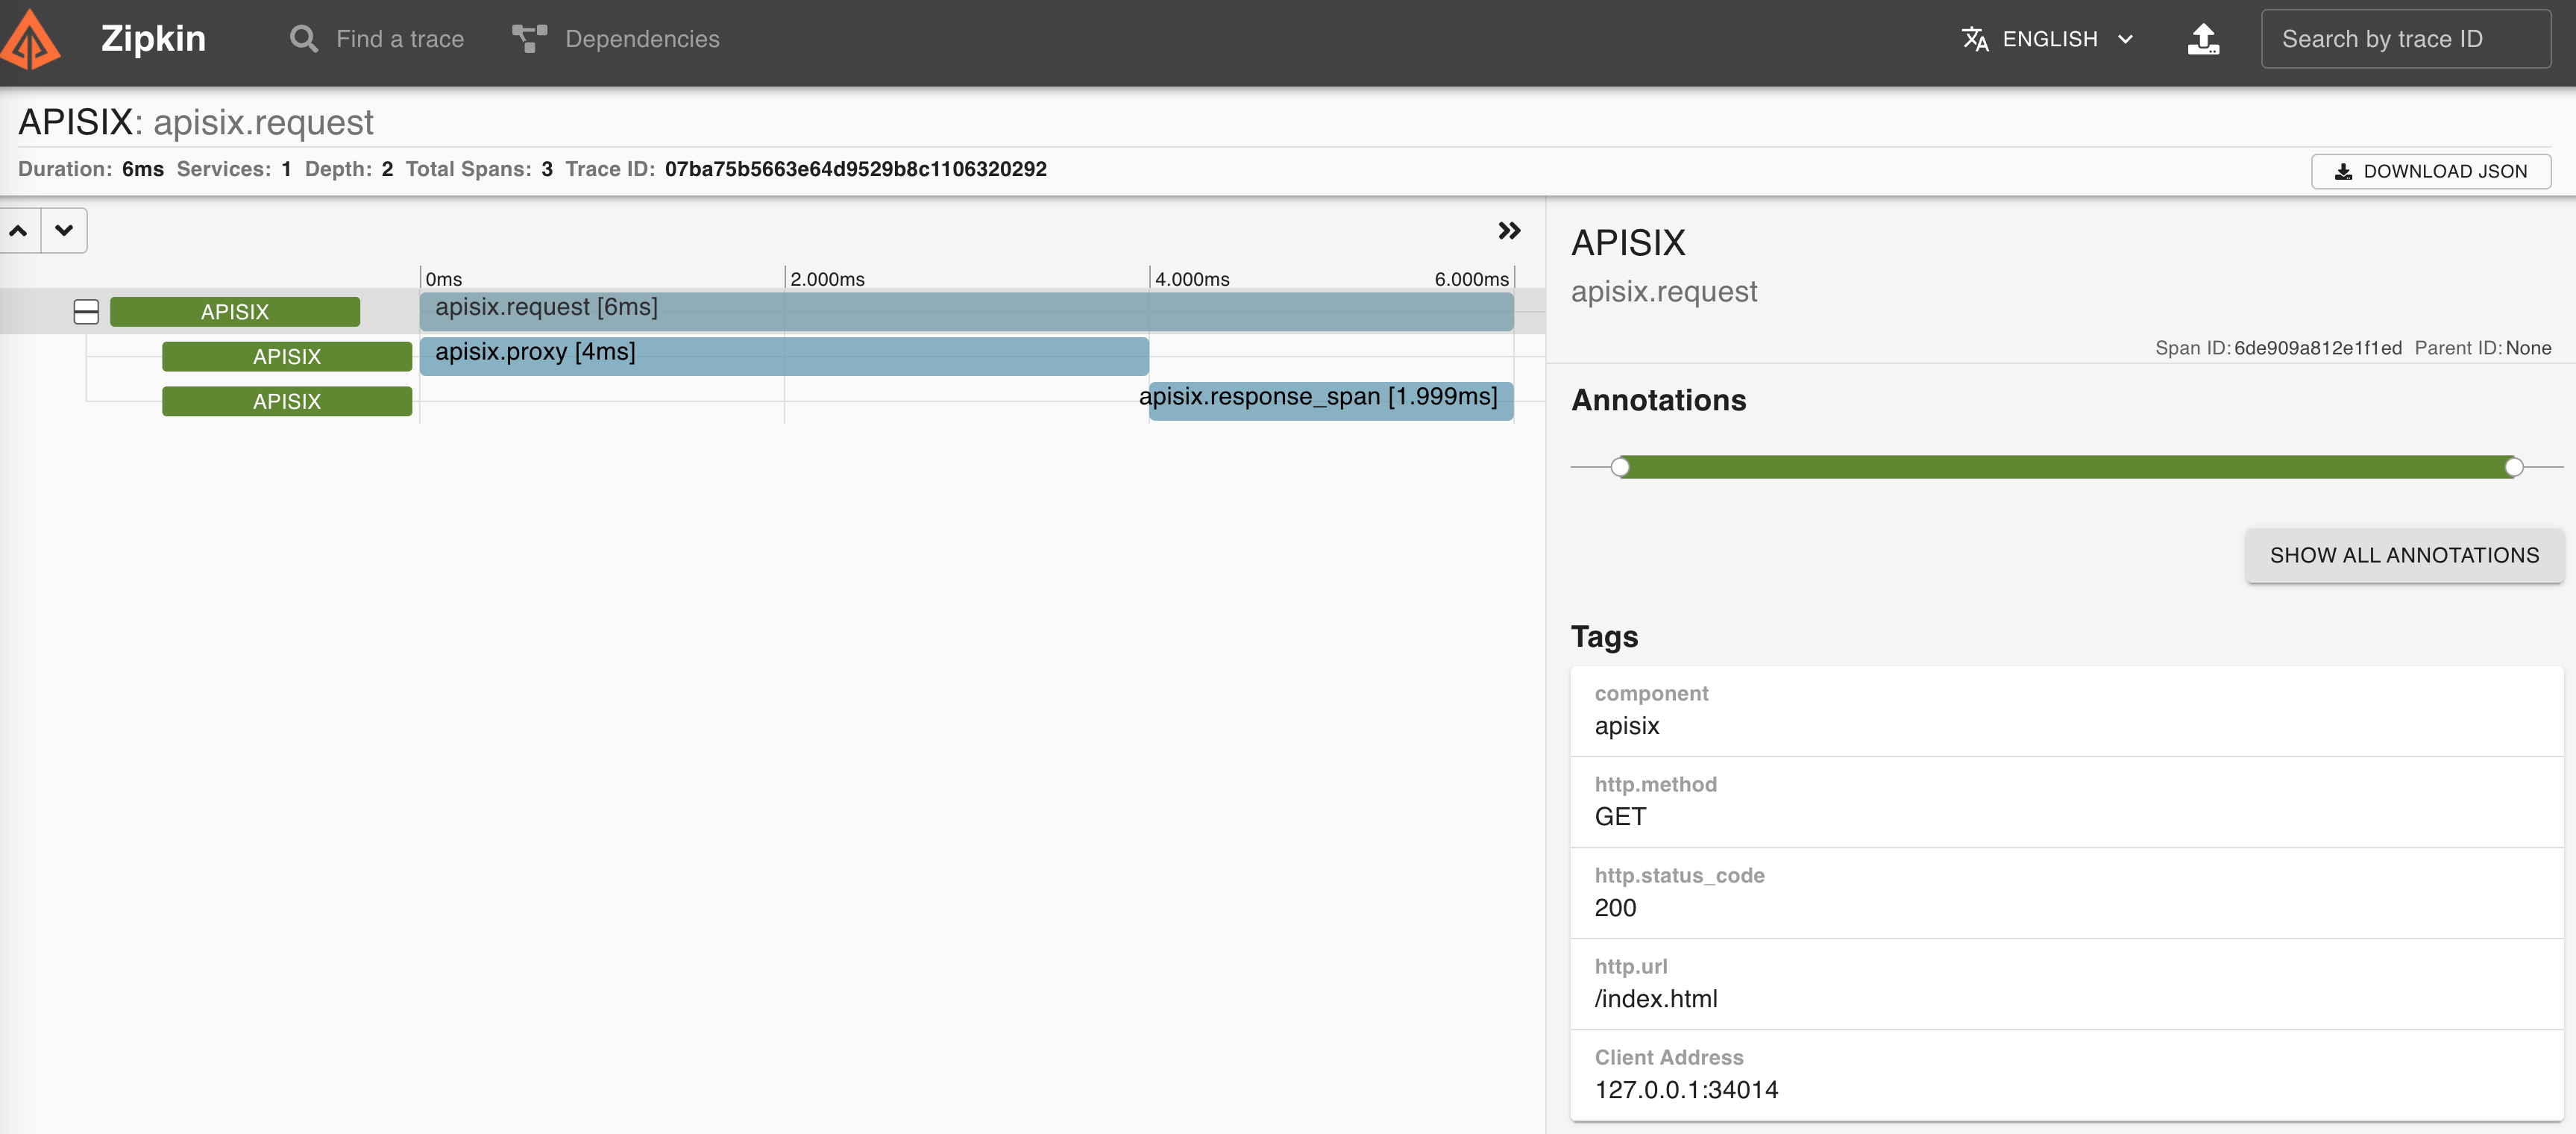
}Then you can use a browser to access http://127.0.0.1:9411/zipkin, see traces on the Web UI of Zipkin
You can find information about other Apache APISIX Observability Plugins here.